Deploying Jenkins with Kubernetes
by John Turner
Posted on February 07, 2017
Kubernetes, Docker, Jenkins
Quick on the heels of my recent overview of the Kubernetes Fundamentals I wanted to dive into deploying something familiar (Jenkins) so that I could focus in on some of the Kubernetes specifics.
Installing Kubernetes Locally
Before going any further I’ll describe my local Kubernetes environment. I’ve previously explored Kubernetes on Google Container Engine and found it effortless. I’ve also used the community provided kube-up scripts to create a local cluster but it appears that this approach has been deprecated. The recommended approach to creating a local Kubernetes environment is using MiniKube.
If you are using Mac, it is fairly trivial to install the components required for MiniKube:
brew cask install virtualbox
brew install kubectl
brew cask install minikube
Note: If you don’t have brew installed you can find the brew installation instructions here.
To start minikube simply invoke:
minikube startAt this point there is a single node Kubernates environment running within a VirtualBox VM. To validate the environment simply invoke:
kubectl cluster-infoThis command will return URL’s for the Kubernetes Master, DNS service and Dashboard.
Kubernetes master is running at https://192.168.99.100:8443
KubeDNS is running at https://192.168.99.100:8443/api/v1/proxy/namespaces/kube-system/services/kube-dns
kubernetes-dashboard is running at https://192.168.99.100:8443/api/v1/proxy/namespaces/kube-system/services/kubernetes-dashboardKubernetes Fundamentals
by John Turner
Posted on February 06, 2017
Kubernetes, Docker
Over the last few years, I’ve been watching with interest the container space in general and specifically the level of interest being generated by the various orchestration options available. I still remain quite sceptical about the ease with which most organizations could effectively adopt containers (and the resulting changes to development and operational practices). However, I do believe that systems like Mesos and Kubernetes will eventually become default deployment environments for all but a few. With that in mind, I’ve decided to dive into Kubernetes to get a better understanding of the opportunities and challenges ahead.
![]()
Kubernetes is a system that has emerged from Google for automating deployment, scaling and management of containerized applications. It is one of a number of orchestration tools whose emergence has coincided with the increasing popularity and maturity of container runtimes such as Docker and rkt. Other orchestration tools include Docker Swarm, Fleet and Mesos.
Each of the previously mentioned orchestration tools incorporate a number of concepts, some of which are very similar and others which are quite distinctive. This can make it quite challenging when you come to learn about one or other (and even more so when you come to compare them). In this post I will briefly describe some of the key concepts you should understand when starting out with Kubernetes.
Read MoreJPA Inheritance Strategies Explained
by John Turner
Posted on April 13, 2015
Last week, I was speaking to an intern who worked for me while I was at Paddy Power. He was explaining with some frustration that he had recently had the supervisor for his final year project reassigned. The guidance from the new supervisor was that the project needed some “wow”. I was not sure if this meant he needed to present the project while flanked by the Dallas Coyboys Cheerleaders so I asked for some specifics. This was the rather perplexing response.
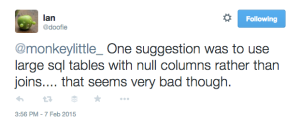
I know Ian is using JPA and I would like to give him a little more information than he received from the above suggestion. So here is my effort at explaining the JPA inheritance strategies.
JPA Inheritance Strategies
The JPA inheritance strategies facilitate mapping of an inheritance hierarchy in 3 different ways. To demonstrate the advantages and disadvantages of each, I will use a class hierarchy comprising a Vehicle, Airplane, Bike and Car.
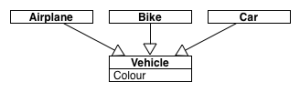
So you can follow or experiment with the code I’ve made it available on GitHub. Note that there are separate repositories for each class, that the Vehicle class is abstract and that each repository has a corresponding test class. I’m using Spring Boot to automatically discover the repositories, entity mappings as well as provide an in memory database for testing purposes.
I’ve enabled the Hibernate SQL logging so that we can see the table DDL as well as the structure of a findAll query executed via each of the repositories.
Read MoreApplication Performance Monitoring - Back to the Future
by John Turner
Posted on March 26, 2014
DevOps, APM
In my previous post Application Monitoring - Past, Present and Future I touched on my desire to see Application Performance Monitoring (APM) vendors add log aggregation and analytics to their service offerings. I’d like to offer further suggestions into what I would like to see in future APM offerings.
Application Insight
The design and function of APM solutions is relatively simple and straightforward to implement. Typically, there exists some form of “Agent” running on the node under observation that relays data to a “Collector”. The “Collector” then stores the data on some form of storage solution. The data is then inspected and presented to a number of services including those that provide functions such as:
- Administration
- Alerting
- Analytics
- Presentation
Let’s not consider the actual data that is being collected other than say it should include all data relevant to application health. Notwithstanding the omission of log data stated earlier, APM solutions from companies such as AppDynamics and New Relic already do a good job of collecting the relevant data at a reasonably low cost (operational overhead, configuration etc.). New Relic has also recently announced the addition of a platform, Rubicon, which allows one to perform in depth analytics on all the data collected (though currently New Relic do not collect distributed tracing data.
I refer to this capability as “Application Insight” and while this space will continue to evolve it does not exactly provide the next big step forward for APM vendors.
The leaders in this space are considered to be AppDynamics and New Relic and they both provide APM. Interesting, they both define APM as application performance management while I would suggest that neither actually perform any management. They stop short at application performance monitoring.
Read MoreApplication Monitoring - Past, Present and Future
by John Turner
Posted on March 16, 2014
DevOps, APM
In addition to working on PaaS and Continuous Delivery initiatives during 2013, I also had the opportunity to learn a lot about Application Performance Monitoring (APM) tools. Because I see PaaS and CD as enabling technologies for DevOps it was natural that I also look at shared tooling such as APM and log aggregation.

Application Monitoring in the Past
In the past, infrastructure monitoring was used as a proxy for the health of an application. Application health was measured in terms of CPU and memory utilisation, disk and network IO or some other infrastructure metric. Some form of translation between the behaviour of the infrastructure and the user experience took place to allow the operations team to understand when the user experience may be adversely affected by symptoms within the infrastructure.
Things changed that meant this approach to application monitoring has become a thing of the past. Applications leverage their infrastructure in very different ways. For example, look at the CPU and memory utilisation profile of a reactive (or event based) system against that of a synchronous request-response system. In one, high CPU utilisation is considered normal while in the other it may signal that the system is overloaded.
Applications have become increasingly distributed so a user experience may be dictated by the performance of a number of application services residing on different OS, using different language runtimes and storage solutions etc. Environments are no longer static and systems are capable of dynamically provisioning and un-provisioning nodes to a cluster. In summary, things just got complicated.
The increased proliferation of technologies, and the distribution and scale of today’s systems means that it has become increasingly difficult to predict system health by measuring the symptoms. We’ve got to actually talk to the patient!
Read More