Application Performance Monitoring - Back to the Future
by John Turner
Posted on March 26, 2014
DevOps, APM
In my previous post Application Monitoring - Past, Present and Future I touched on my desire to see Application Performance Monitoring (APM) vendors add log aggregation and analytics to their service offerings. I’d like to offer further suggestions into what I would like to see in future APM offerings.
Application Insight
The design and function of APM solutions is relatively simple and straightforward to implement. Typically, there exists some form of “Agent” running on the node under observation that relays data to a “Collector”. The “Collector” then stores the data on some form of storage solution. The data is then inspected and presented to a number of services including those that provide functions such as:
- Administration
- Alerting
- Analytics
- Presentation
Let’s not consider the actual data that is being collected other than say it should include all data relevant to application health. Notwithstanding the omission of log data stated earlier, APM solutions from companies such as AppDynamics and New Relic already do a good job of collecting the relevant data at a reasonably low cost (operational overhead, configuration etc.). New Relic has also recently announced the addition of a platform, Rubicon, which allows one to perform in depth analytics on all the data collected (though currently New Relic do not collect distributed tracing data.
I refer to this capability as “Application Insight” and while this space will continue to evolve it does not exactly provide the next big step forward for APM vendors.
The leaders in this space are considered to be AppDynamics and New Relic and they both provide APM. Interesting, they both define APM as application performance management while I would suggest that neither actually perform any management. They stop short at application performance monitoring.
Application Intelligence
When I consider what I want from an application performance management solution I most certainly want some level of autonomic behaviour. IBM coined the phrase “Autonomic Computing” way back in 2001 (they did bugger all with the research worth talking about but hey, that’s IBM for you!) and they defined autonomic computing as having four functional areas:
- Self-configuration: Automatic configuration of components.
- Self-healing: Automatic discovery and correction of faults.
- Self-optimisation: Automatic monitoring and control of resources to ensure the optimal functioning with respect to the defined requirements.
- Self-protection: Proactive identification and protection from arbitrary attacks.
The thrust of the concept is that systems should apply self-* principles to make intelligent runtime adaptations to the system behaviour. I call this “Application Intelligence”
Colonel John Boyd was a United States Air Force fighter pilot and consultant to the Pentagon. Boyd hypothesized that all intelligent organisms and organizations undergo a continuous cycle of interaction with their environment. Boyd breaks this cycle down to four interrelated and overlapping processes through which one cycles continuously:
- Observation: the collection of data by means of the senses
- Orientation: the analysis and synthesis of data to form one’s current mental perspective
- Decision: the determination of a course of action based on one’s current mental perspective
- Action: the physical playing-out of decisions
“Application Insight” gives us the capability to apply the Observe, Orientate and Decision process while “Application Intelligence” gives us the capability to apply the Action process. In the context of todays APM solutions, the action process is applied via the same mechanism through which application metrics are collected. That is, the same runtime code instrumentation that collects application metrics at the “edge of the node” can be used to modify the behaviour. I’ll explain this by way of a couple of examples.
The Timeout
Lets consider a very simple request from a client to a service. This request represents a client invoking a RESTful service and awaiting a response.
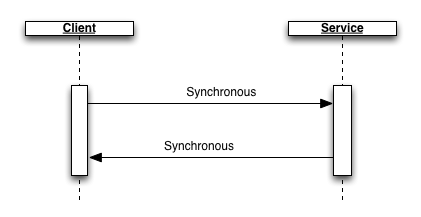
It is well understood that in order to prevent the client continuing to wait for a response when the service is not responding in a timely fashion, the client should implement a request timeout. The request timeout is typically set based on some expectation of service or prior knowledge of service behaviour. The process of deciding what an appropriate timeout should be can actually be quite difficult. Indeed, it may also be appropriate that the timeout change over time.
Now lets consider applying APM and the OODA loop to the problem of deciding an appropriate timeout for the service call. We already know that APM solutions gather metrics on service response times and error rates. This gives us the information to allow us to apply some basic heuristics to determine an appropriate timeout for the service call. The heuristics could be the following:
- Set the timeout to some arbitrarily high value.
- Observation: Collect metrics on service response time and error rates.
- Orientation: Analyze the data to determine the optimal timeout.
- Decision: If the dataset is statistically significant, adjust timeout.
- Action: Adjust the timeout.
This provides a degree of self-optimization and therefore active management of the application performance.
Lets continue with a second example.
The Circuit Breaker
Lets consider again the simple scenario in Figure 1 and apply the concept of a Circult Breaker to service requests. During normal operations the circuit is considered closed and requests are forwarded to the service. In the event of a number of service failures, the circuit breaker trips and requests are no longer forwarded to the service. Instead, the circuit breaker automatically returns an error response. This has the effect of reducing the load on the service allowing some period of time for the service to recover (perhaps through auto-scaling). After some period of time the circuit breaker is restored and requests are once again forwarded to the service.
It comes as no surprise the applying APM and the OODA loop to the problem we can implement the Circuit Breaker. The heuristics could be the following:
- Set the failure count to zero.
- Observation: Record failure count within a contextual (temporal and request count) window.
- Orientation: Analyze the data to determine the significance of the failure count given throughput.
- Decision: If the dataset is statistically significant, trip circuit breaker.
- Action: Trip circuit breaker.
This again provides a degree of self-optimization and therefore active management of the application performance.
The Handshake
Handshaking allows the service to throttle requests in order to protect itself. Based on some measure of load, the service automatically rejects requests with a response such as a 503 service unavailable if the load is beyond what the service can cater for. When load returns to normal, the service starts to accept requests once more. The heuristics could be the following:
- Observation: Record load as some function of request count, latency, resource utilization and downstream service performance.
- Orientation: Analyze the data to determine service health.
- Decision: If health is deteriorating, reject incoming requests.
- Action: Reject incoming requests.
Wrapping Up
So this stuff is not exactly novel. Michael Nygard has documented the above patterns in his book, Release It!. Netflix have implemented these patterns in their Hystrix library that they have made open source.
My take away point is that APM solutions exist where the “M” stands for monitoring. I would like an APM solution where the “M” stands for management.