Application Monitoring - Past, Present and Future
by John Turner
Posted on March 16, 2014
DevOps, APM
In addition to working on PaaS and Continuous Delivery initiatives during 2013, I also had the opportunity to learn a lot about Application Performance Monitoring (APM) tools. Because I see PaaS and CD as enabling technologies for DevOps it was natural that I also look at shared tooling such as APM and log aggregation.

Application Monitoring in the Past
In the past, infrastructure monitoring was used as a proxy for the health of an application. Application health was measured in terms of CPU and memory utilisation, disk and network IO or some other infrastructure metric. Some form of translation between the behaviour of the infrastructure and the user experience took place to allow the operations team to understand when the user experience may be adversely affected by symptoms within the infrastructure.
Things changed that meant this approach to application monitoring has become a thing of the past. Applications leverage their infrastructure in very different ways. For example, look at the CPU and memory utilisation profile of a reactive (or event based) system against that of a synchronous request-response system. In one, high CPU utilisation is considered normal while in the other it may signal that the system is overloaded.
Applications have become increasingly distributed so a user experience may be dictated by the performance of a number of application services residing on different OS, using different language runtimes and storage solutions etc. Environments are no longer static and systems are capable of dynamically provisioning and un-provisioning nodes to a cluster. In summary, things just got complicated.
The increased proliferation of technologies, and the distribution and scale of today’s systems means that it has become increasingly difficult to predict system health by measuring the symptoms. We’ve got to actually talk to the patient!
Application Monitoring in the Present
I’ve looked at a lot of the APM vendors currently operating in the marketplace and have been really impressed with how application monitoring has evolved to where it is today. In my opinion, the significant features of todays APM offerings are:
- Distributed transaction tracing
- Application topology detection
- Automatic entry and exit detection
- Lossless or aggregated metric collection
- Adaptive alerting thresholds
- Auto-scaling notifications
Distributed Transaction Tracing
Way back in April 2010, Google published a paper on ‘Dapper, a Large-Scale Distributed Systems Tracing Infrastructure’. The subject matter is not new but people tend to listen more attentively when Google speaks. Dapper facilitates tracing service calls that traverse a graph of distributed servers or containers. The image below shows a distributed trace for a web request as captured by Zipkin, Twitters distributed tracing system.
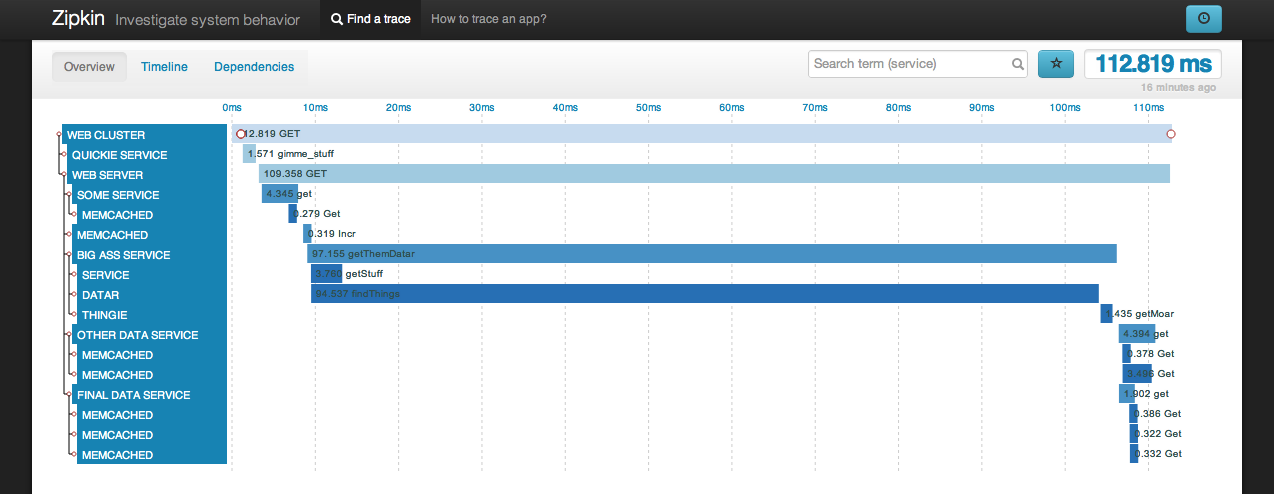
As systems become more distributed the ability to visualise distributed call graphs is immeasurable. From the graph above I can see the touch points involved in a particular request, the latency contributed by each of these touch points and the concurrency of service invocations.
Application Topology Discovery
The collection of distributed transaction tracing data has another nice property or side effect; that is the ability to dynamically build the application topology based on the way in which services communicate with one another. Below we see an example of such a visualisation as presented by AppDynamics.
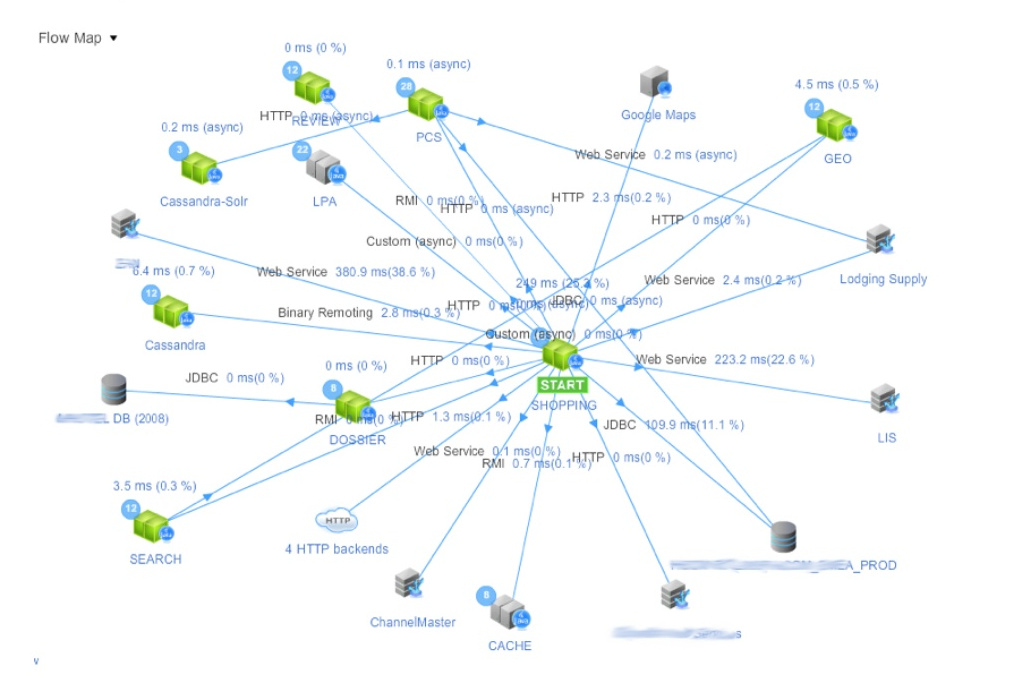
This ‘Flow Map’ is able to present a considerable amount of information in a single view. With this type of view (note: not necessarily this particular view) I’m able to see any of the following:
- The services involved in responding to a request.
- The latency within those services.
- The latency between those services.
- Variation in latency within service clusters.
Comparing how this view evolves over time I might also be able to see:
- New service instances servicing requests.
- Service instances not servicing requests.
Automatic Entry and Exit Detection
Distributed tracing has a notion of entry and exit detection. This is the ability to start and stop a transaction trace. The easiest way to think about this is to think about a single method trace. If I want to trace a method it is reasonable for me to expect that I must specify the fully qualified path to this method to allow the tracing tool to instrument the code (either at compile time or runtime). If this method is well known such as the JMS listener onMessage(…) method I would expect the tracing tool to do this automatically. The trace would start on method entry and stop on method exit. Expand this to consider distributed tracing and we have automatic entry and exit detection.
Turns out that identifying what to trace has quite a big overhead in a heterogeneous environment and so this automatic detection takes a significant burden off your development and operations teams. If you also consider a dynamic system with releases every day, week or month it does not take long to incur considerable spend just updating your monitoring tools.
You also want to be able to define the entry and exit detection manually though for situations where the entry and exit points are not well known.
Lossless or Aggregated Metric Collection
There is still a debate over collecting and retaining all available metrics as opposed to sampling and/or aggregating metrics. The trade-offs are quite obvious.
When sampling and/or aggregating:
- The infrastructure requirements for network and storage are reduced.
- Heuristics are executed on the system being observed so there may be an increased compute (CPU and memory) overhead.
- When aggregating, segmentation of data is limited.
- Data is lost and so rare events may not be recorded.
The point on segmentation of data is worth expanding upon. Lets consider a user making a request from their browser to a backend service. The request is tagged on the web server with a unique identifier. The APM agent then tags this request with the user identifier, browser, location etc. Each of these tags allows the tracing data to be viewed along a different dimension. If we want aggregation to result in reduced bandwidth utilisation we must aggregate on the client which in turn increases the compute overhead on the client. To limit this, you limit the amount of segmentation of the metrics data.
Limiting the segmentation of data is ok if we are creating operational dashboards from this data but becomes limiting when creating business dashboards. I’m not in any way saying this is a bad thing but that it is a trade off.
When collecting all available metrics:
- The infrastructure requirements for network and storage are increased.
- Overhead on the system being observed is limited to the overhead imposed by transporting the data.
- All data is captured and available for extensive analytics external to the system being observed.
- All data is captured so even rare event are recorded.
Adaptive Thresholds
We spoke about how automatic entry and exit detection reduces the operational overhead (or TCO in sales speak) of owning and managing a monitoring solution. One of the other duties that go along with deploying monitoring solutions is setting the high and low water marks for alerting. This can be arduous when the system topology or behaviour is changing rapidly.
Some of today’s solutions attempt to take the overhead of setting thresholds away by using heuristics on historical data. The success or otherwise of this approach is therefore based on both the quality of the heuristics and data. It could be argued that it is always better for a human to set these levels as they can have better knowledge of the system and its behaviours. It can also be argued that in reality humans are time poor and often just set watermarks to so arbitrary level that ‘seams reasonable’.
Personally, I would like to be able to set the baseline watermarks using heuristics and manually adjust where necessary. With this approach I don’t have arbitrary settings that ‘seem reasonable’ but I’m also facilitated in changing watermarks when I have more insight than the heuristics and data could possible have.
Auto-Scaling Trigger
I’ve seen auto scaling become increasingly prevalent in both public and private cloud environments (see IaaS: Making a Case for Infrastructure as a Service. Ordinarily auto scaling is triggered by infrastructure metrics like CPU and memory.
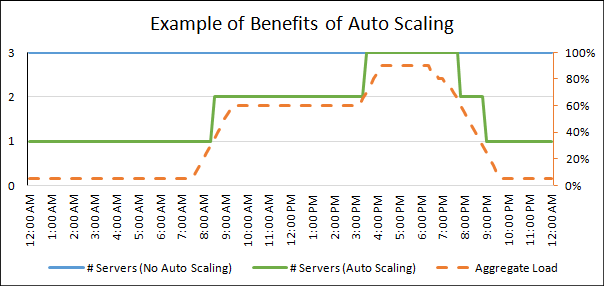
How much better would it be to base scaling triggers on the response time or throughput of the service rather than the behaviour of the infrastructure it resides upon. It is certainly a lot more intuitive if I am setting watermarks manually. If I tell you that at the 99th percentile a user receives a response in 100ms then that is quite meaningful without any knowledge of the system. If I tell you that the CPU is at 55% then it is a lot less meaningful. The CPU might be burning cycles in an event loop providing good, adequate or poor response times to the user.
Application Monitoring in the Future
The main thing that I would like to see in APM tools in the future is that they incorporate log aggregation capabilities.
Log Aggregation
If you have implemented APM and log aggregation tooling you’ll know that the infrastructure required by both is remarkably similar. There is typically an agent responsible for streaming data to some form of intermediary. There is then some for of analytics platform as well as a portal that allows you to manage all that goodness. Why or why can’t they be the same thing (I fear someone will actually answer this!)?
Here is a challenge to APM vendors: I often hear Splunk being proposed as a solution for distributed tracing and application monitoring. I’d like to see you get into the log aggregation space because I don’t want to deploy two similar infrastructures that allow me to export runtime data from my applications.